Custom reports
THE GOALROLETEAM MEMBERSLet merchants build the reports that matter most to them.
Product design lead
Project manager, frontend developer, backend developer
Let’s set the stage.
When I first started at Recharge in 2017, the product didn’t have any analytics. Merchants had to look to third-party tools to measure the success of their subscription efforts.
Over time, we built a comprehensive analytics platform into the Recharge product, including over 14 pre-built dashboards and 23 done-for-you reports.
However, a common theme when talking to merchants was that every merchant was unique. They had their own questions to ask and things to care about when it came to their analytics. A one-size-fits-all solution would never serve everyone well.
We were particularly hearing this feedback when it came to reports.

How might we let merchants keep track of the metrics that mean the most to them?
The current state of reports
We already had a lot of reports built for merchants. These reports:
Fell under 4 categories (revenue, customers, subscriptions, actions)
Gave date range controls
Gave minimal display controls (display by day/week/month)
Allowed filtering by product, variant, or segment
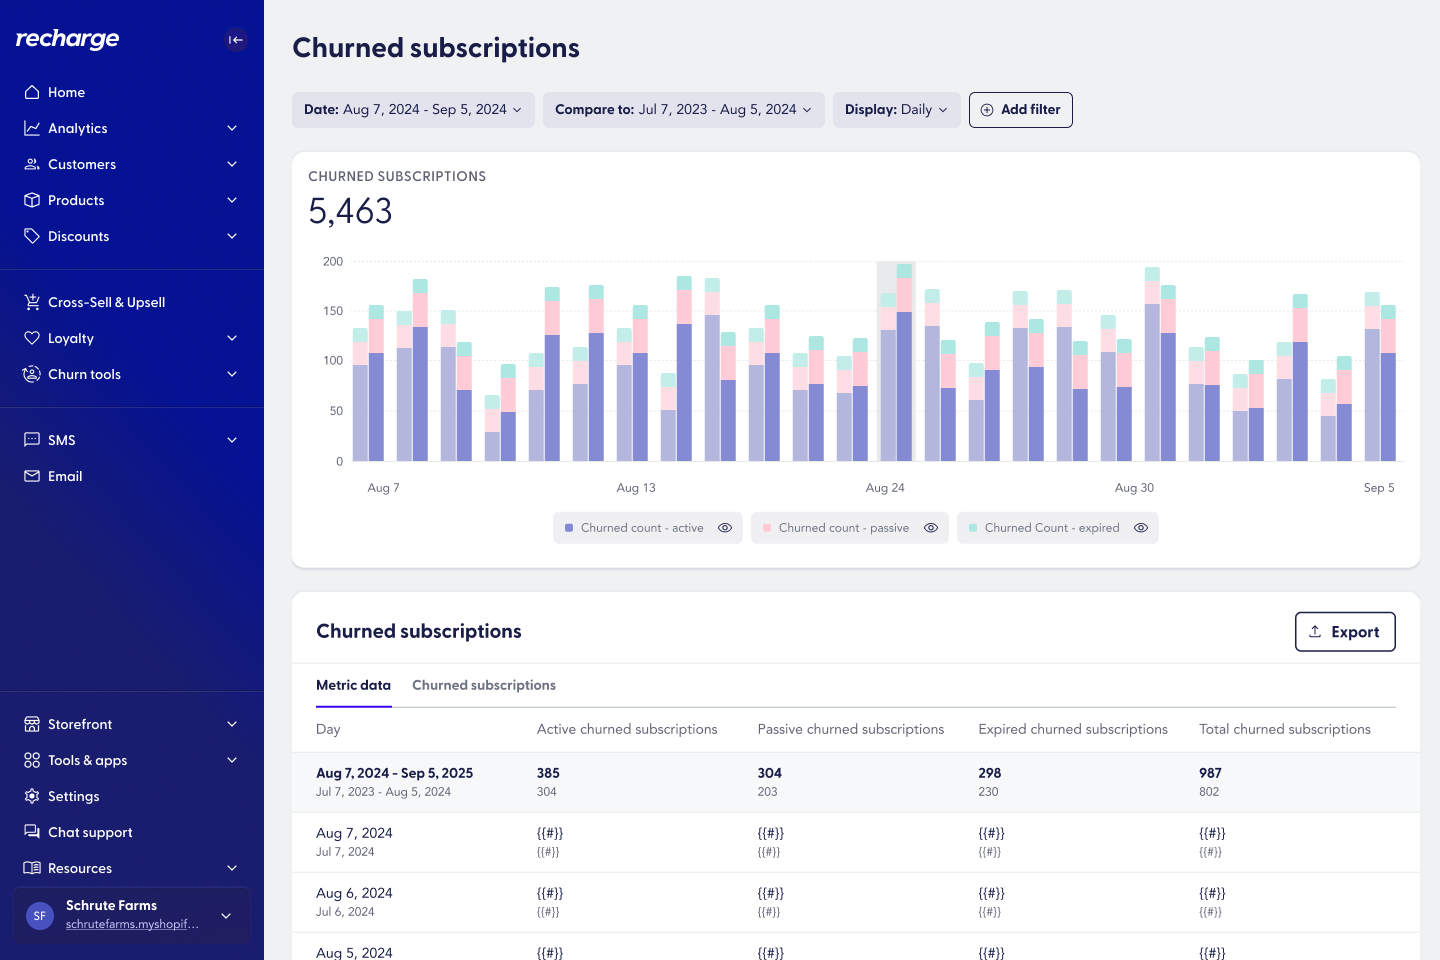
An example of an existing reportProblems with the current state of reports
Merchants could customize reports to their heart’s desire, but they couldn’t save their custom views. Merchants would have to come back to a report, reproduce all of their filters and customizations every single time they wanted to see it.
Filters and grouping controls were limited and didn’t allow merchants to slice their data many ways.
Loading times were lengthy whenever a merchant made a change to the view.
Existing reports wayfinding couldn’t support a growing list of reports.
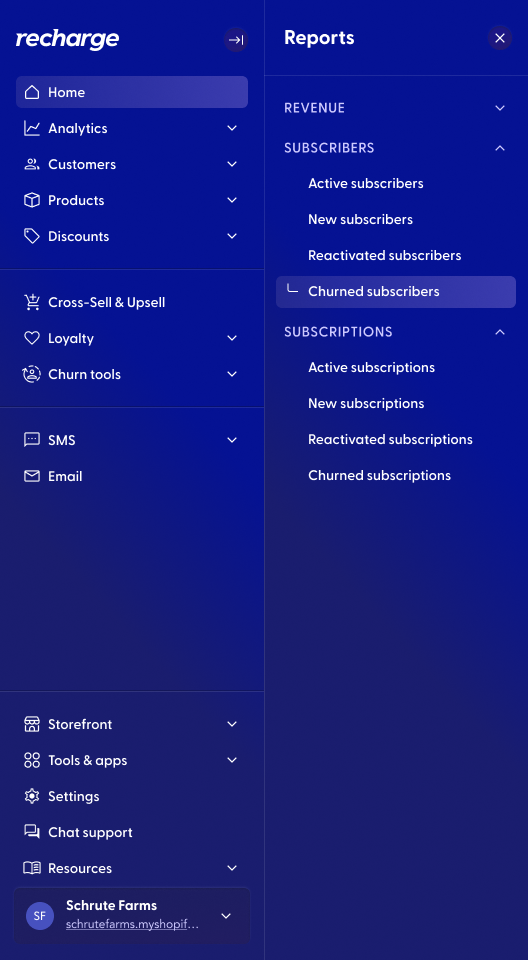
Old reports navigation was built into our main sidebar navigationThe goal:
Allow merchants to customize and build reports that are uniquely meaningful to them.
Let merchants modify existing reports and save them
Let merchants build brand new reports, from scratch
Expand report controls so merchants can find exactly the data they need
Reduce time spent waiting on a report to load
Revamp reports wayfinding, planning for a world with many more reports
Priorities
This was a lot to tackle all at once, and backend needed us to ease into steps of the project here. The project manager and I decided it would be best to break out our goals into milestones:
Milestone #1: Let merchants save reports
Milestone #2: Let merchants more easily find reports
Milestone #3: Improve functionality for existing reports
Milestone #4: Allow merchants to build brand new reports from scratch
Milestone #1: Let merchants save reports
This was the first step forward. How might we allow merchants to save the modifications they were making to existing reports so that they could quickly and easily come back to their custom views?
We didn’t need to reinvent the wheel here, as we had save patterns already established in app.
We did have a key decision to make: Would we let merchants override preset reports? Because we wanted merchants to always be able to access our preset reports and their value, we decided merchants could not save “over” one of the Recharge presets. This behavior was consistent with Shopify’s custom report builder, which is a familiar space for our merchants.
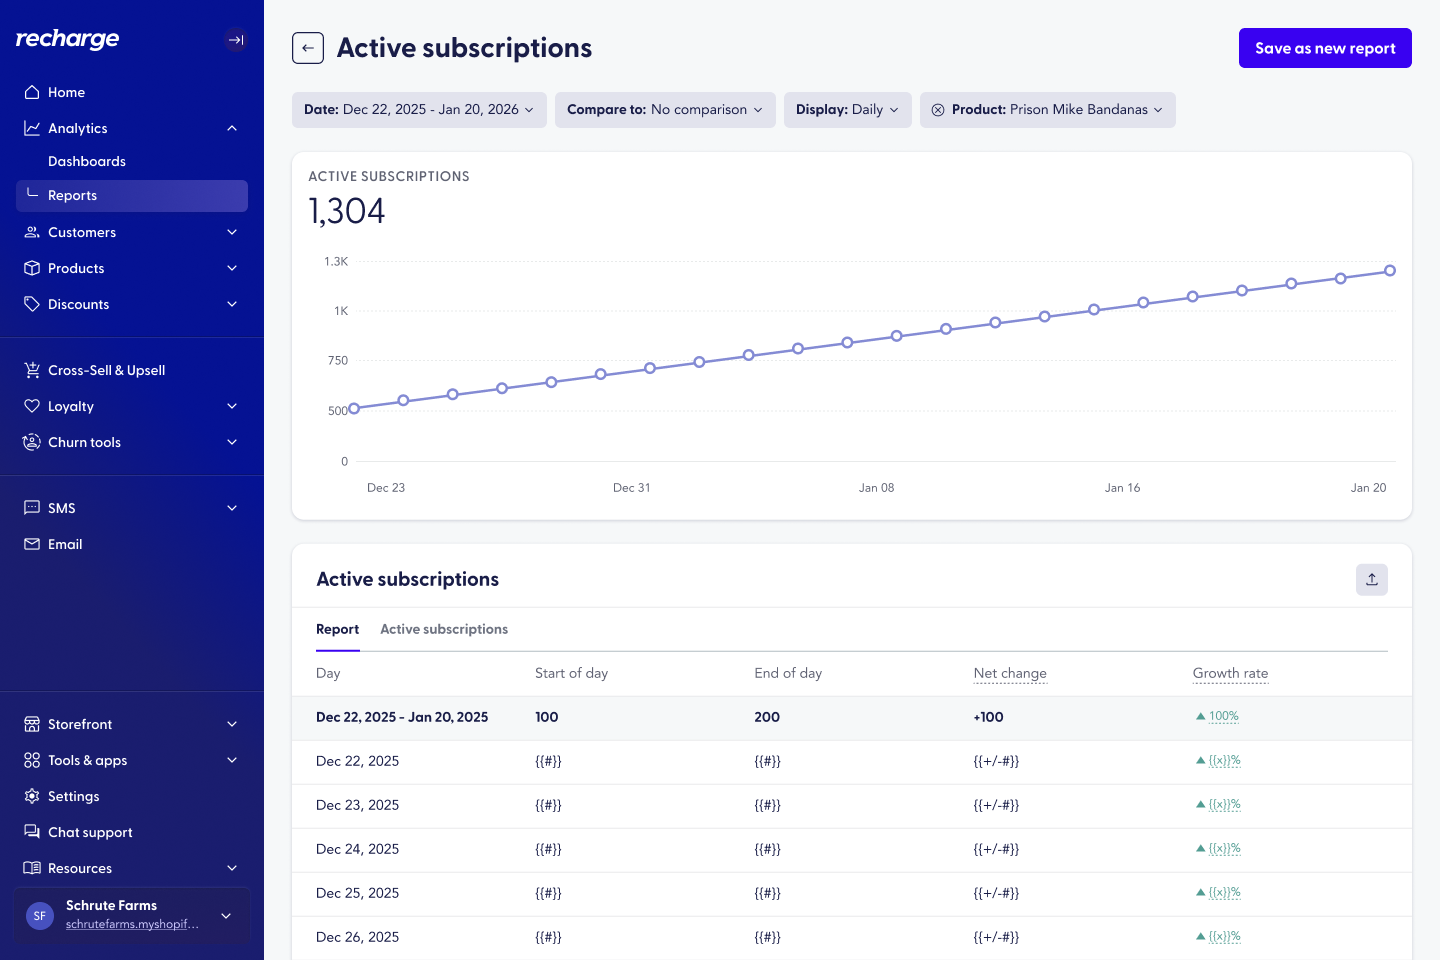
A preset report would only have “Save as new report”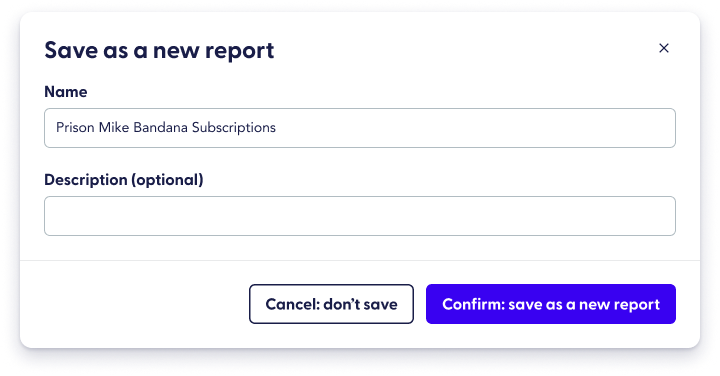
Merchants would be prompted to name their new report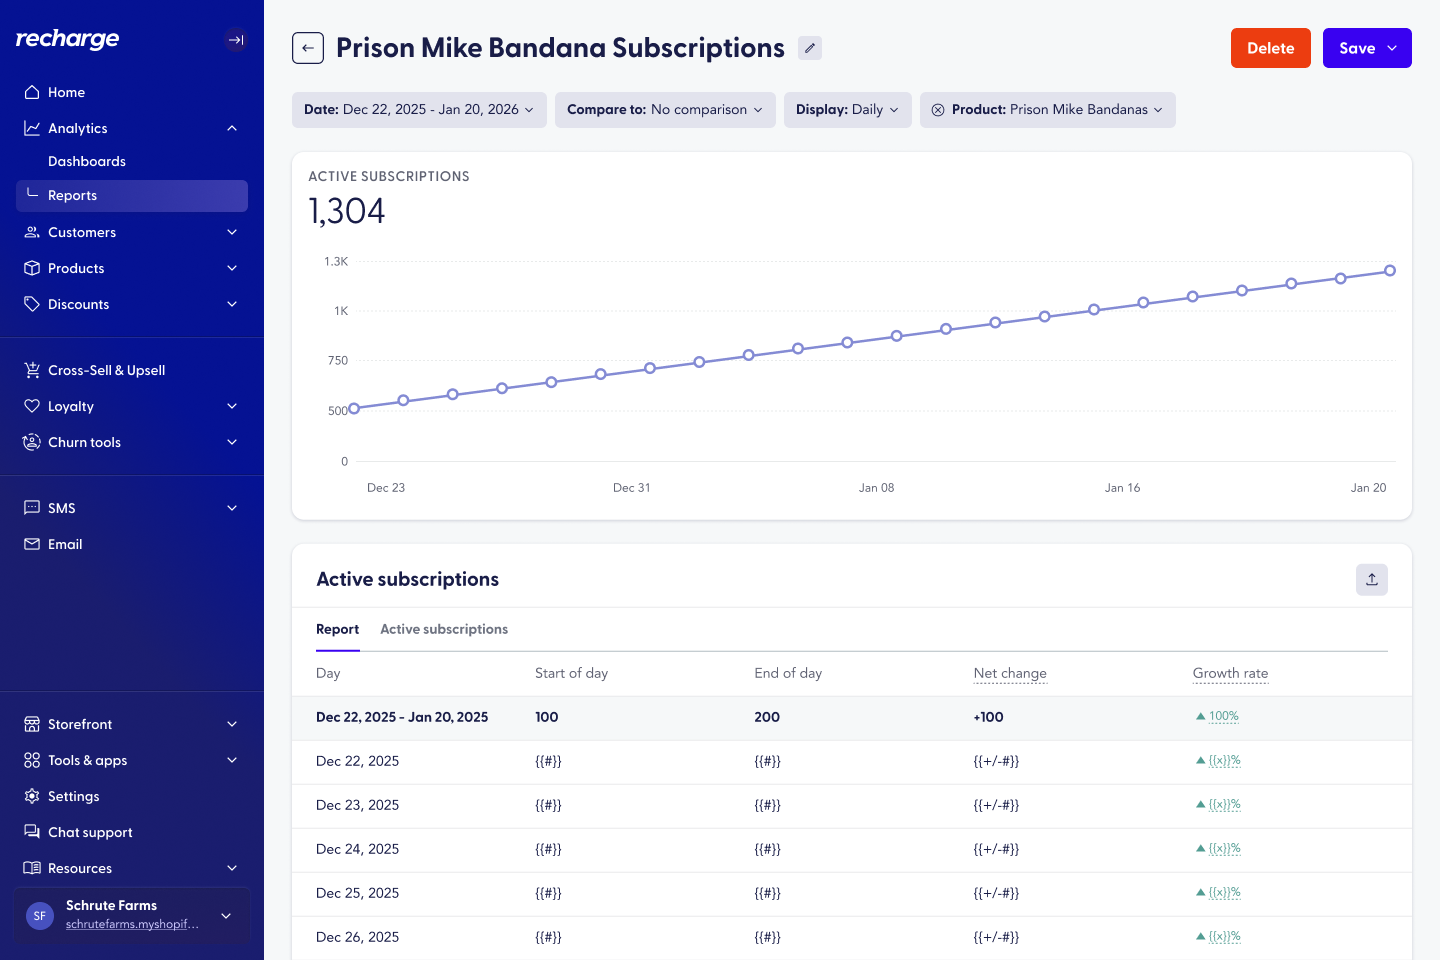
Custom reports could be deleted, saved, or saved as newMilestone #2: Let merchants more easily find reports
The existing path to reports was a secondary navigation panel with expandable/collapsible sections. This path served merchants well in a world with finite reports. However, in a world where merchants could save and eventually create their old reports, this solution meant an ever-growing list of reports with no means of searching or filtering.
Existing navigationWe needed a scalable pattern that would allow merchants to create an unlimited number of reports and find them easily. Leaning on industry leader best practices (like Shopify) and UX principles, we landed on a list view. This list view would let merchants uniquely name their reports, search and filter their reports, categorize them, sort them by most updated, and see who created them. This path paved the way for future growth.
New list view patternMilestone #3: Improve functionality for existing reports
There were a few limitations with existing reports:
Every separate control took lots of loading time, so a merchant wanting to choose a specific date range, view at the weekly grain, and filter by 4 products would have to wait after each one of those separate controls.
Controls themselves were limited. We only allowed one filter at a time, so merchants couldn’t filter by products and segments. Merchants couldn’t group their data by dimensions that were relevant to them, so they could only see their data over time.

Existing report controlsWe needed to give merchants more ways to slice their data and a means of doing so effortlessly.
After observing merchants in Fullstory and chatting with them on calls, we learned that it was pretty common for a merchant to adjust the date, display, and add filters. What if we combined all of these common actions into a single control so that merchants only had to wait once instead of 3 times?
This led us to build a singular “Report controls” panel where merchants could make all of the changes they want at one time and only wait once.
Within this panel and with collaboration from backend engineers, we also expanded functionality. Merchants could not filter by multiple items, choose their visualization, and group by
Filtering by products, changing the visualization, grouping by weekFiltering by products, grouping the data by product & variant titleMilestone #4: Allow merchants to build brand new reports from scratch
We had a made a lot of improvements to reports, but the last problem to solve was that merchants still had to start from an existing report. We wanted to remove the guardrails completely and open up a flexible future even more.
How might we allow merchants to start from scratch?
There were a few backend constraints:
Reports needed a category to be selected to determine which metrics could be used
Reports needed metrics selected to work
Fun fact: I designed the prototype below entirely with Claude code and outside of Figma. With the help of our frontend developers, we built a “design playground” that lives inside our frontend monorepo where designers can play with ideas and push MRs with live preview links for stakeholders to view.
With ideas in mind for how we might work custom reports into our existing reports ecosystem, I was able to prompt Claude to build the experience I wanted, complete with touches of delight like the empty state animation.
Existing report controlsKnowing that merchants needed to select a category right away, I added a modal on report creation, with descriptions of each category, that helped merchants start off in the right direction. While we wanted to work with our existing panel, I did auto-expand the panel on report creation and added a banner to draw attention to the metric selection and removed filters/visualizations/groupings from the panel to reduce noise until metrics were selected.
After this, we could essentially reuse existing patterns. Because we had worked ourselves into the build-from-scratch phase, almost everything was out of the box for us from here. We had panel config patterns, save patterns, naming patterns, etc. These were just some light touches at the end to put the final polish on.
Filtering by products, changing the visualization, grouping by weekObservations so far
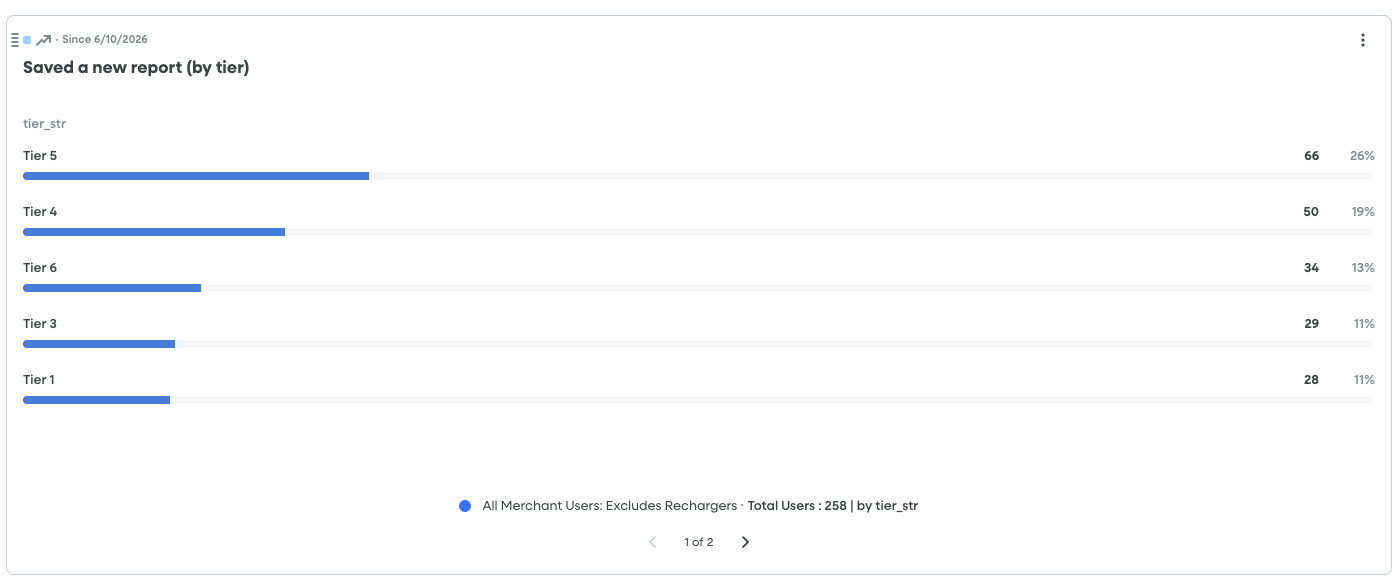
We’ve been tracking the project in two ways—merchant conversations and Fullstory behavioral tracking. We launched milestone #1 (the ability to save a new report) on June 10, 2026. One month since the launch, we had 248 unique users save a custom report. This is without any sort of campaign advertising the new functionality. Of these users, only 16 (6.4%) deleted their report. Filters and groupings had a lot of engagement.
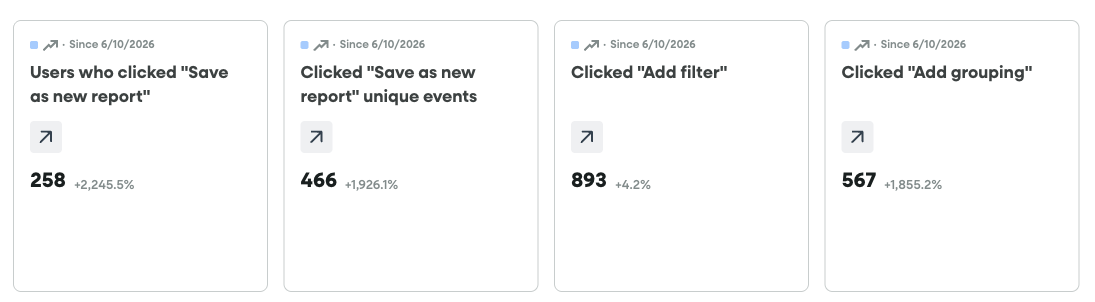
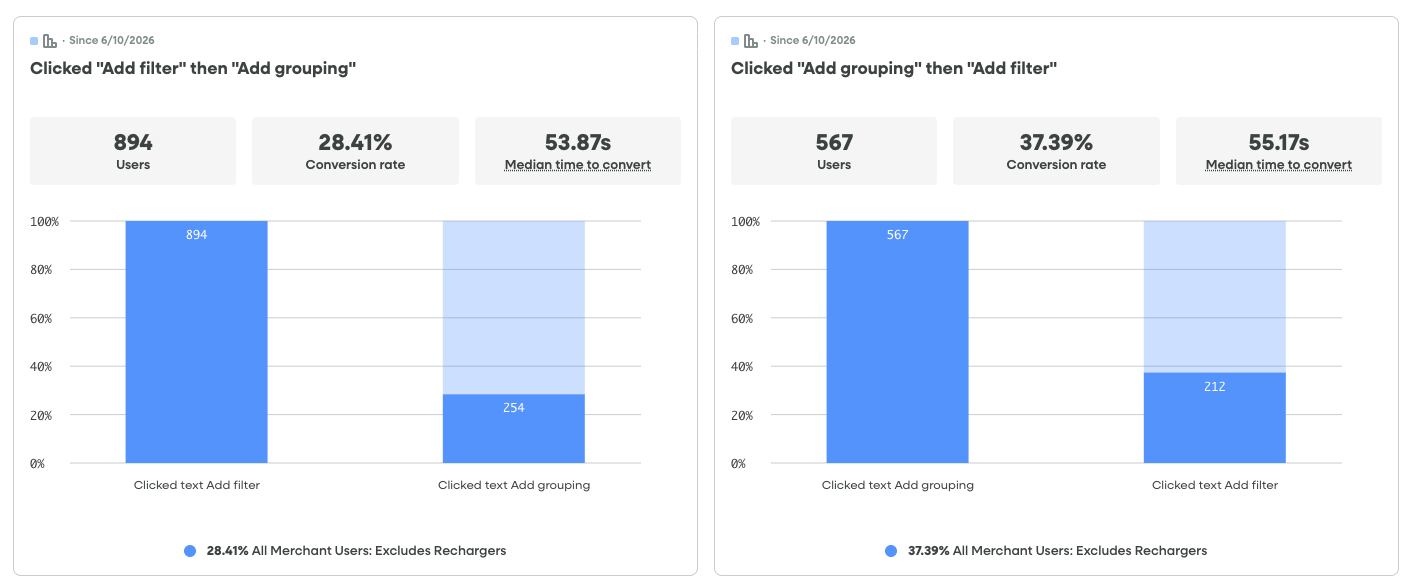
We’re seeing merchants add filters and groupings within the same session, with 28% adding a filter and then a grouping, and 37% adding a grouping then a filter. This supports the decision to house controls within the same panel.
Custom report usage has been heavier with tiers 4-6, which is what we expected as these tiers are usually smaller stores with fewer resources. Higher tier stores typically have robust custom analytics solutions. This shows that custom reports is hitting its intended audience but also doesn’t alienate larger stores.